BokehでグラフをJavaScriptとして出力してWebページに埋め込んでみた
グラフをWebページに埋め込んで、インタラクティブなWebアプリっぽくしたい。でもJavaScriptわからない。そんなときにBokehのembed.componentsを使おう。
Bokehのバージョンは0.13.0を使っている。
componentsに描画するグラフのFigureオブジェクトを渡すと、JavaScriptを記述したscriptタグとグラフ部分のdivタグがタプルとして返ってくる。
scirpt, div= components(plot)
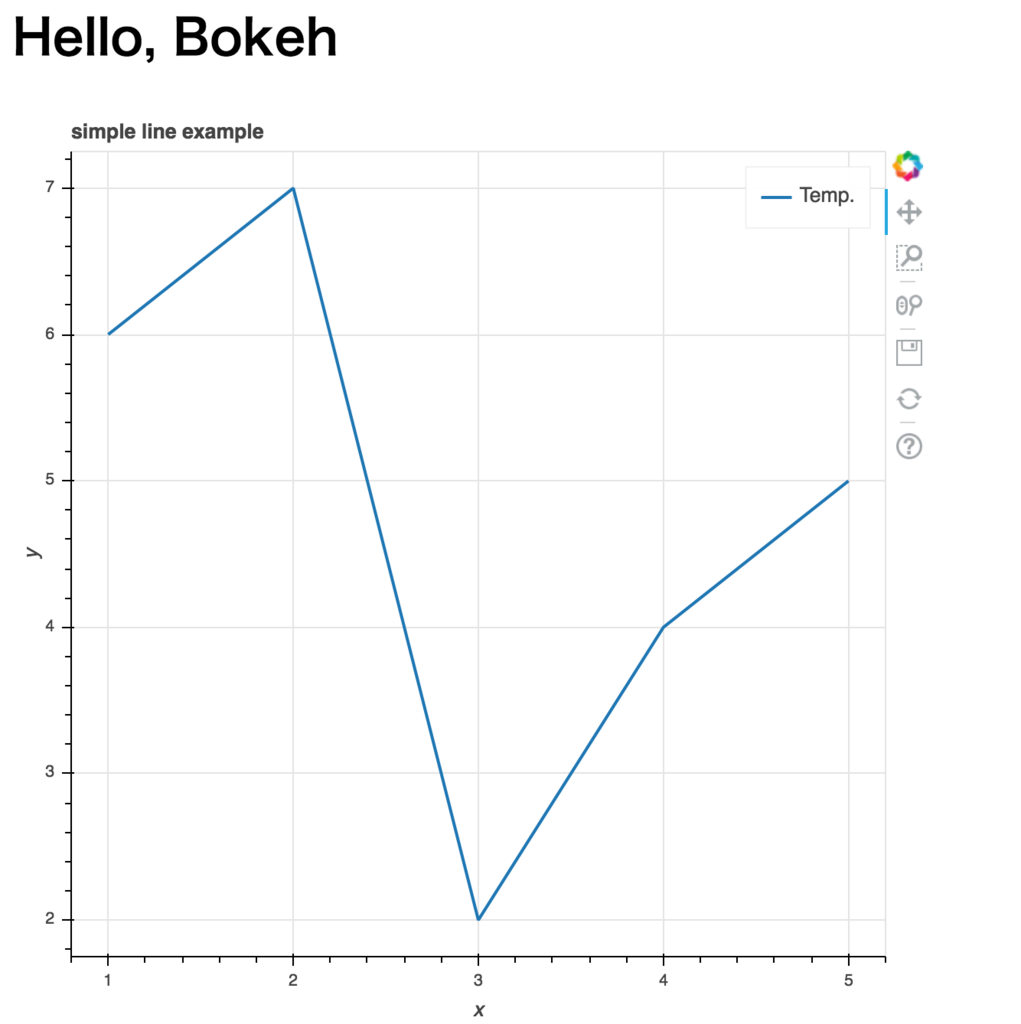
手始めにBokehのQuickstartにある折れ線グラフを表示してみる。
from bokeh.embed import components
from bokeh.plotting import figure
from flask import Flask, render_template

app = Flask(__name__)


def get_line_graph():
    # prepare some data
    x = [1, 2, 3, 4, 5]
    y = [6, 7, 2, 4, 5]

    # create a new plot with a title and axis labels
    p = figure(title="simple line example", x_axis_label='x', y_axis_label='y')

    # add a line renderer with legend and line thickness
    p.line(x, y, legend="Temp.", line_width=2)
    print(type(p))

    return p

@app.route('/')
def index():
    plot = get_line_graph()
    script, div = components(plot)
    return render_template('index.html', script=script, div=div)
<!DOCTYPE html>
<html>
<head>
    <title>Flask Bokeh Sample</title>
    <link rel="stylesheet" href="https://cdn.pydata.org/bokeh/release/bokeh-0.13.0.min.css" type="text/css" />
    <link rel="stylesheet" href="https://cdn.pydata.org/bokeh/release/bokeh-widgets-0.13.0.min.css" type="text/css" />
    <link rel="stylesheet" href="https://cdn.pydata.org/bokeh/release/bokeh-tables-0.13.0.min.css" type="text/css">

    <script type="text/javascript" src="https://cdn.pydata.org/bokeh/release/bokeh-0.13.0.min.js"></script>
    <script type="text/javascript" src="https://cdn.pydata.org/bokeh/release/bokeh-api-0.13.0.min.js"></script>
    <script type="text/javascript" src="https://cdn.pydata.org/bokeh/release/bokeh-widgets-0.13.0.min.js"></script>
    <script type="text/javascript" src="https://cdn.pydata.org/bokeh/release/bokeh-tables-0.13.0.min.js"></script>
</head>

<body>
    <h1>Hello, Bokeh</h1>
    {{ script|safe }}
    {{ div|safe }}
</body>

</html>
Jinja2のsafeフィルタを使うことで、Flaskから渡した文字列をHTMLとして埋め込むことができる。テンプレートで気をつけておきたいのはCSSやJavaScriptをCDNから読み込むときのバージョン。Bokehの最新バージョンに合わせておこう。ここでは0.13.0としている。
このStackOverFlowの回答を参考にしたが、動かなかったので試しにバージョンを最新にしたら動いた。
さて、上記のコードを実行すると以下のようなWebページになる。動かせるし、ズームも保存もできる。

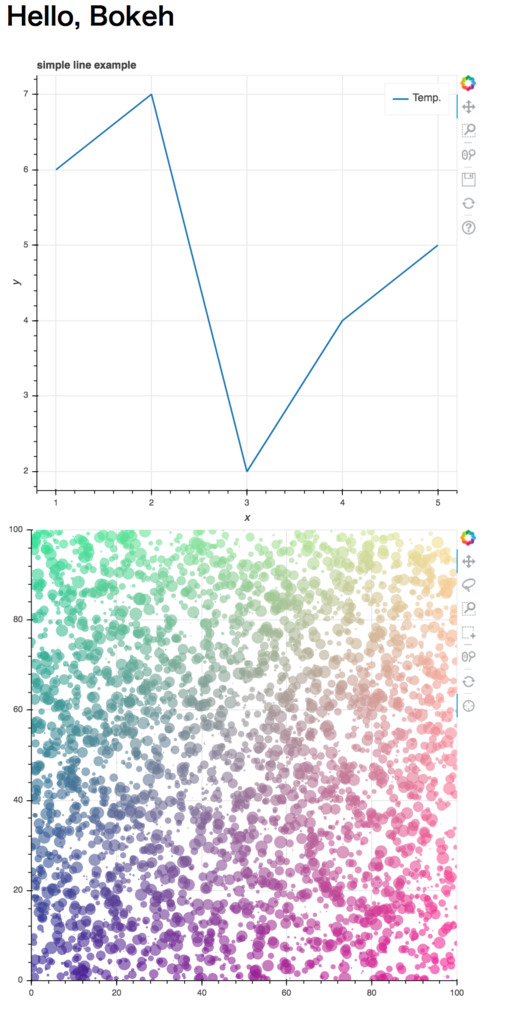
複数のグラフを埋め込むときはcomponents()メソッドにFigureオブジェクトが入ったタプルを渡す。すると、divタグがタプルとして返ってくる。
以下、折れ線グラフに加えて散布図を埋め込んだ例。
from bokeh.embed import components
from bokeh.plotting import figure
from flask import Flask, render_template
import numpy as np

app = Flask(__name__)


def get_line_graph():
    # prepare some data
    x = [1, 2, 3, 4, 5]
    y = [6, 7, 2, 4, 5]

    # create a new plot with a title and axis labels
    p = figure(title="simple line example", x_axis_label='x', y_axis_label='y')

    # add a line renderer with legend and line thickness
    p.line(x, y, legend="Temp.", line_width=2)
    print(type(p))

    return p

def get_scatter():
    # prepare some data
    N = 4000
    x = np.random.random(size=N) * 100
    y = np.random.random(size=N) * 100
    radii = np.random.random(size=N) * 1.5
    colors = [
        "#%02x%02x%02x" % (int(r), int(g), 150) for r, g in zip(50 + 2 * x, 30 + 2 * y)
    ]

    TOOLS = "crosshair,pan,wheel_zoom,box_zoom,reset,box_select,lasso_select"

    # create a new plot with the tools above, and explicit ranges
    p = figure(tools=TOOLS, x_range=(0, 100), y_range=(0, 100))

    # add a circle renderer with vectorized colors and sizes
    p.circle(x, y, radius=radii, fill_color=colors, fill_alpha=0.6, line_color=None)

    return p


@app.route('/')
def index():
    line = get_line_graph()
    scatter = get_scatter()
    plots = (line, scatter)
    script, div = components(plots)
    return render_template('index.html', script=script, div=div)
<!DOCTYPE html>
<html>
<head>
    <title>Flask Bokeh Sample</title>
    <link rel="stylesheet" href="https://cdn.pydata.org/bokeh/release/bokeh-0.13.0.min.css" type="text/css" />
    <link rel="stylesheet" href="https://cdn.pydata.org/bokeh/release/bokeh-widgets-0.13.0.min.css" type="text/css" />
    <link rel="stylesheet" href="https://cdn.pydata.org/bokeh/release/bokeh-tables-0.13.0.min.css" type="text/css">

    <script type="text/javascript" src="https://cdn.pydata.org/bokeh/release/bokeh-0.13.0.min.js"></script>
    <script type="text/javascript" src="https://cdn.pydata.org/bokeh/release/bokeh-api-0.13.0.min.js"></script>
    <script type="text/javascript" src="https://cdn.pydata.org/bokeh/release/bokeh-widgets-0.13.0.min.js"></script>
    <script type="text/javascript" src="https://cdn.pydata.org/bokeh/release/bokeh-tables-0.13.0.min.js"></script>
</head>

<body>
    <h1>Hello, Bokeh</h1>
    {{ script|safe }}
    {{ div.0|safe }}
    {{ div.1|safe }}
</body>

</html>

以上、BokehのグラフをJavaScriptにしてWebページに埋め込む方法。
BokehのWidgetsを使うとダッシュボードめいたやつとか作れそう。